 FACT CHECKED
Applied observability is when a company uses tools to watch and study how their systems, apps, and services work so they can learn useful things from the information they gather.
Applied observability helps a company make sure their software works well by using information in a smart and connected way. It can help a company in many different areas by turning the information they get from watching their systems into useful outcomes.
According to Gartner’s research, by 2026, organizations that have successfully applied observability will be able to make decisions faster and gain a competitive edge over their competition. This is expected to account for 70% of all businesses.
With the integration of applied observability practices into a company’s data lifecycle management (DLM) approaches, organizations and software engineers can use their insights to create an all-encompassing view of operations.
Nonetheless, this requires utilizing sophisticated tactics for analyzing business operations information to accurately decipher available facts. This equips decision-makers with the knowledge they need immediately to make wise decisions more quickly and effectively.
To reap the full benefits, businesses must ensure that their data is up-to-date and accurate. By utilizing AI-driven automation and machine learning, applied observability can yield greater accuracy and reliability in data capture while ensuring that the generated results apply to the specific needs of each enterprise.
In this segment of our Digital Adoption Trend Report 2023, we’ll share how CIOs and IT leaders can leverage applied observability to fortify operational processes and increase business velocity. From identifying emerging trends in data capturing to uncovering new applications of AI-driven automation, the report will explore what drives businesses toward digital transformation and provide key insights into how this technology can be used for improved efficiency and greater results.
At the end of this report, readers will clearly understand what applied observability is, how to use it effectively, and why businesses must leverage it for better decision-making. The report will also provide detailed, actionable recommendations on implementing this technology within their organization.
What Is Applied Observability?
Applied observability can be defined as the ability to track the state and performance of software applications over time. It is a comprehensive approach for collecting data on software systems that can then be used to gain insights into system health, observability problems, and potential improvements.
This data can include logs, metrics, and events from all components of a software system, including the application and its underlying infrastructure. This data can then be used to generate real-time observability charts, reports, and insights that can help organizations quickly identify and resolve application and infrastructure observability issues.
Applied observability offers a holistic and coordinated approach to utilizing observable data across multiple business areas. It shortens the lead time between stakeholder activities and organizational responses by providing a way for businesses to proactively plan decisions.
By combining the data they collect and analyzing it with AI-driven automation, applied observability helps businesses make better decisions faster. In addition, distributed systems, such as microservices and cloud computing, make storing and analyzing data within the organization easier to create more targeted insights.
Why Is Applied Observability Important?
Applied observability is dedicated to the notion that a business’s success relies on forecasting what lies ahead and crafting plans based on factual data. This aspiration serves as applied observability’s main compass for progress and growth. Through the diligent application of applied observability, businesses can reduce their response times to customer inquiries and bolster the efficacy of their daily operations.
To realize the advantages of observability, it is essential to be proactive instead of reactive. For example, IT professionals who leverage stakeholders’ actual behaviors and activities rather than merely relying on guesses or assumptions will have a significant edge over their competition. Analyzing observable data makes it possible to look for improvements in customer service, operational efficiency, and speed.
Applied observability also enables organizations to uncover hidden patterns in their data that can help them identify operational issues, recognize trends, improve process optimization, increase customer satisfaction, make informed decisions regarding product launches, and realize cost savings.
Software engineering teams can reap tremendous benefits by employing observability as well. Testing various hypotheses and making data-driven decisions can minimize the risk of system failure and reduce development time. Observability solutions provide a comprehensive view of what’s going on within a system. This helps engineers quickly detect and diagnose issues and identify areas of improvement for system reliability.
The Three Verticals of Applied Observability
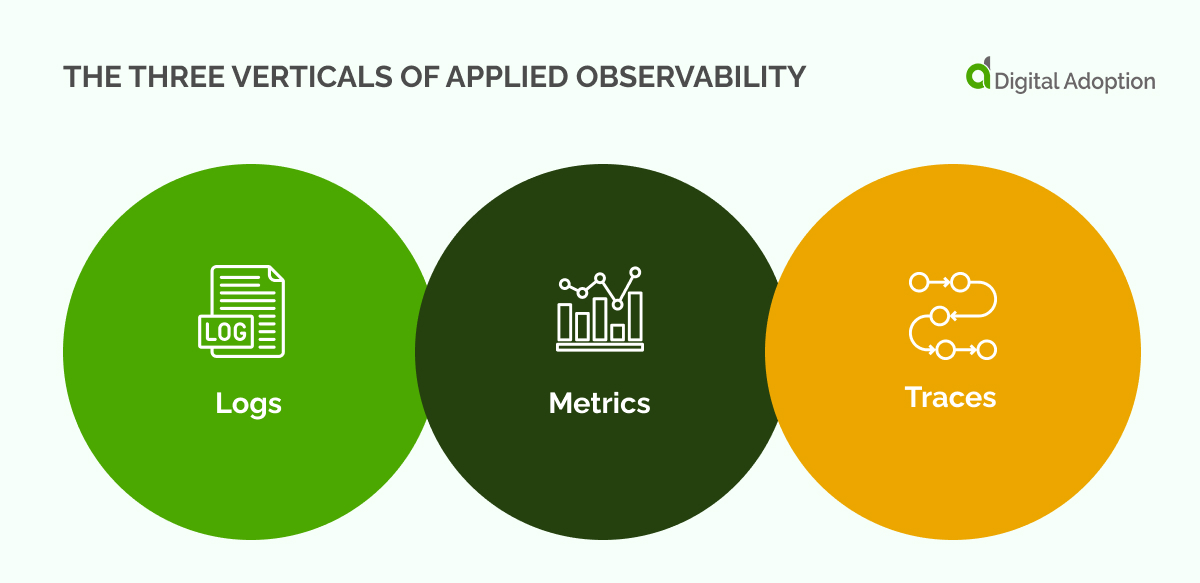
Most observability tools deal with the three pillars of observability: logs, metrics, and traces. This means they can collect and analyze data from these sources and provide a unified view of system performance. Logs give information on system events, metrics are numerical measurements of resource utilization and performance, and traces track the flow of a system request through its components. Let’s explore these three pillars in depth.
Logs
Logs are a record of events that occur in the system over time. They can provide details about errors, application performance, and more. Applied observability tools can aggregate log data, analyze it for patterns and anomalies, and provide alerts when something unexpected occurs.
Metrics
Metrics are numerical measurements that can be used to monitor a system’s health. Applied observability solutions can collect metrics from various sources, such as log files, application performance management tools, and system resources. These metrics can then be analyzed to determine trends, identify correlations between different events, and even detect problems in the system before they become serious.
Traces
Traces can be used to track a request’s flow through the system from start to finish, including all the components it touches. Applied observability solutions can capture traces as they happen and use them to detect bottlenecks, latency problems, and other performance issues. This helps teams diagnose and resolve problems quickly, reducing system downtime and improving user experience.
By understanding the three pillars of applied observability, teams can use the right tools to gain valuable insights into their systems and identify potential problems before they become serious.
Components Of Applied Observability
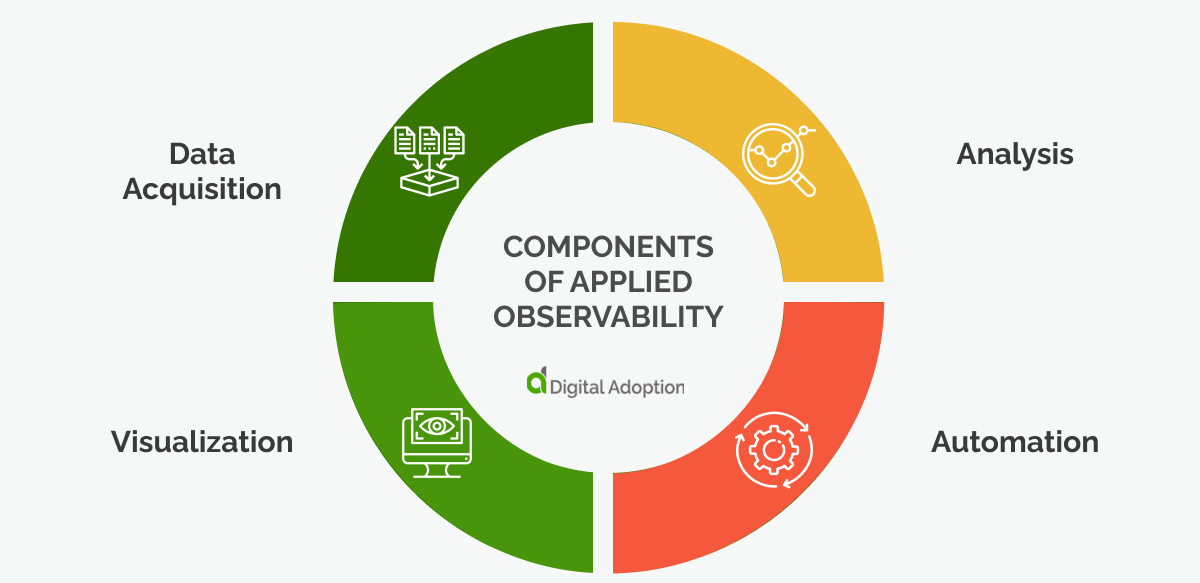
In addition, other components of applied observability include data acquisition, analysis, automation, and visualization. It’s important to understand each component and its role in applied observability so that organizations can optimize their use of this powerful technology.
Let’s take a more in-depth look at four major components of applied observability:
Data Acquisition
Data acquisition is gathering data from different sources for further analysis and use. Data acquisition is a critical step in any applied observability initiatives, as it provides the basis for all other activities, such as modeling, forecasting, and decision-making. It involves collecting data from various sources, including databases, files, and other external sources such as surveys or interviews.
Data acquisition is accomplished through various methods, including manual entry of data into a database or program, automated collection from Internet resources, and web scraping. In addition, machine learning and artificial intelligence tools can be used for automation in data acquisition. The goal of data acquisition is to obtain the most accurate, complete, and consistent data set that will allow the organization to make better decisions.
Data acquisition processes are typically customized to fit the needs of the project and organization. Depending on the nature of the data, it may require different collection methods, including manual entry, automated harvesting from websites or web scraping, and machine learning algorithms.
Once the data has been collected, it must be stored in a secure manner to protect its integrity. Data can then be analyzed using various techniques such as descriptive statistics or AI and ML algorithms. Observability tools can collect, analyze, monitor, and visualize metrics and traces. This gives users valuable insights into system performance, errors, usage patterns, and more.
Analysis
Analysis of the gathered data is then used to make decisions, conclusions, and predictions. It can also detect patterns, trends, and correlations in the data. Data analysis allows organizations to better understand their customers, products, services, and operations.
Careful consideration must be taken when collecting data from various sources, as this will affect how accurate the results are of any analysis. The right tools and processes should be in place to ensure the accuracy, completeness, and consistency of the data acquired.
Data analysis allows organizations to gain valuable insights from the data that can lead to better decisions and improved performance.
Visualization
Data visualization is an important part of any applied observability process. Visualizing data helps organizations gain insights more quickly and easily. Using visualizations, data can be presented in a way that is easier to interpret, aiding decision-making processes. Visualizing data also provides an easy way to share information with stakeholders, helping them make better decisions based on the data collected.
Applied observability is an important tool for any organization looking to make informed decisions based on data. By leveraging the right tools and processes, organizations can maximize the value of their data and gain insights that will help them take advantage of opportunities while also avoiding potential pitfalls.
Visualization is crucial in applied observability, helping organizations quickly detect issues and better understand customer behavior. Organizations can make better decisions and improve their performance with applied observability.
Automation
Digital transformation efforts continue to accelerate as organizations seek ways to leverage the digital disruption of recent years and maximize business outcomes. Adopting and acquiring new technology means that IT leaders become increasingly responsible for monitoring various complex and dynamic systems.
This can include capturing, storing, analyzing, and presenting data using manual human processes. Using outdated monitoring procedures may be suitable for overseeing basic, static systems but quickly prove inadequate for maintaining the complex and ubiquitous IT ecosystems found today.
This can lead to IT teams feeling inundated with an overwhelming number of metrics. The majority of data generated by companies remains both unseen and unused, despite its potential to deliver meaningful insights. By switching strategic approaches and opting for observability over monitoring, IT teams can gain greater visibility over vast continuous data sets and distributed environments.
As such, automation has become a crucial component of applied observability, allowing organizations to detect issues quickly and take necessary action in a timely manner. Automation also increases the accuracy of the data collected, helps reduce manual errors, and enables faster processing of large amounts of data.
Automation of data acquisition is also possible through deep learning technologies like artificial intelligence (AI) and machine learning (ML). The emergence of artificial intelligence for IT operations (AIOps) means that organizations now have access to disruptive bleeding-edge technologies that provide them with more efficient ways to extract data value.
This could include automating issue detection, automatically determining root cause analysis, or even automating remediation. AI-augmented automation compliments observability initiatives by delivering insights on a much larger scale and at higher accuracy.
Measuring The Impact of Applied Observability
To accurately measure the impact of applied observability, businesses must track and monitor multiple KPIs related to customer experience, efficiency gains, cost optimization, risk management, and process development.
By monitoring these metrics over time and comparing the results to past performance levels, companies can identify opportunities for improvement and begin to understand how their data-driven decisions influence overall business performance.
It’s crucial to measure the impact of applied observability over a period of time, as it can take weeks or even months before an organization begins to reap the benefits of AI-driven automation. However, with continuous monitoring, businesses can identify problems early on and adjust accordingly.
Identifying The Demand Criterion For Applied Observability Solutions
The need for an observability solution is propelled by various forces, ranging from the ever-growing demand for digital services to the urgency of dealing with complex IT systems and applications.
To make an informed decision, it is essential to consider the following factors:
- The demand for applications to manage ever-increasing corporate activities is greater than it has ever been before.
- The demands of users have reached their peak, and they will not hesitate to switch tools if they experience unfavorable interactions.
- Development teams constantly innovate and refine applications and software systems to reduce release cycles and keep up-to-date with the latest technology.
- In the modern era, IT teams manage both traditional and cloud-native applications.
- Distributed system architectures, especially those built with microservices and cloud-native technologies, have become increasingly complex. As a result, it’s necessary to use observability tools to help debug systems and improve their performance.
- The use of cloud-based services and third-party APIs is rapidly increasing as organizations recognize their immense potential to benefit businesses at all levels.
Due to these factors, the complexity, dependencies, and points of failure in a distributed architecture have skyrocketed. A Cisco poll of more than 1000 worldwide IT decision-makers revealed that the quick rate of modernization and digital transformation during the pandemic has drastically magnified this issue even further.
Consequently, massive amounts of operational data are generated throughout the technical chain – from applications to infrastructure and networks. It’s become increasingly difficult for organizations to manage this complexity due to a lack of visibility and an inability to prioritize their strategies.
How To Use Applied Observability In Your Organization
Applied observability provides businesses with real-time, actionable data to gain an understanding of their systems and operations. Companies can then use this data for a number of purposes, such as improving system performance, gaining insights into customer behavior, and optimizing processes to increase efficiency. This can be achieved by monitoring the system’s performance and integrating applied observability into the existing analytics infrastructure, giving businesses a holistic view of their operations.
Here are some additional tips for using applied observability in your organization:
- Automate data acquisition process as much as possible to ensure the data’s accuracy, completeness, consistency, and timeliness
- Use AI and machine learning tools to automate anomaly detection and forecasting processes
- Leverage visualization techniques to interpret data quickly and easily.
- Take advantage of predictive analytics to anticipate customer needs and develop strategies accordingly
- Monitor the performance of your business operations through dashboards or alerts so you can take action when necessary
- Analyze customer feedback or other structured sources to gain insights into customer behavior
- Leverage automation to help scale the applied observability processes
- Utilize site reliability engineers (SREs) to ensure the proper functioning of all systems
- Use actionable insights to optimize the end-user experience
- Integrate insights from analytics to measure and improve marketing campaigns
- Develop predictive models to anticipate changes in customer demand or market trends
Preparing For The Future: Applied Observability
As data collection and analysis become increasingly instrumental in forecasting the future state of IT operations, organizations will need to invest in the right tools and processes to maximize the value of their data. Observability is not a single technique or definite market, it’s an interconnected collection of organizational layers and business processes that leverage tools for collecting data to be observed.
Gartner predicts that in the next five years most companies that apply observability will experience a reduction in decision-making latency, thus giving them an edge over their competition.
By applying the best practices outlined in this article, businesses can easily prepare for the future by incorporating applied observability into their operations. The goal of this practice is to gain an in-depth grasp of how a system works, ultimately enabling teams to make sound judgments about enhancing its capabilities.

")
")


