 FACT CHECKED
It’s not enough to make a popular product these days. You must measure what made that product engaging or sticky to understand what you got right and what you can incorporate into future products for efficient customer adoption.
With the costs of acquiring a user at USD 14,772, it makes sense to optimize your product stickiness strategies to ensure that when products fall into your users’ hands, they stay there, and you learn why they enjoy them.

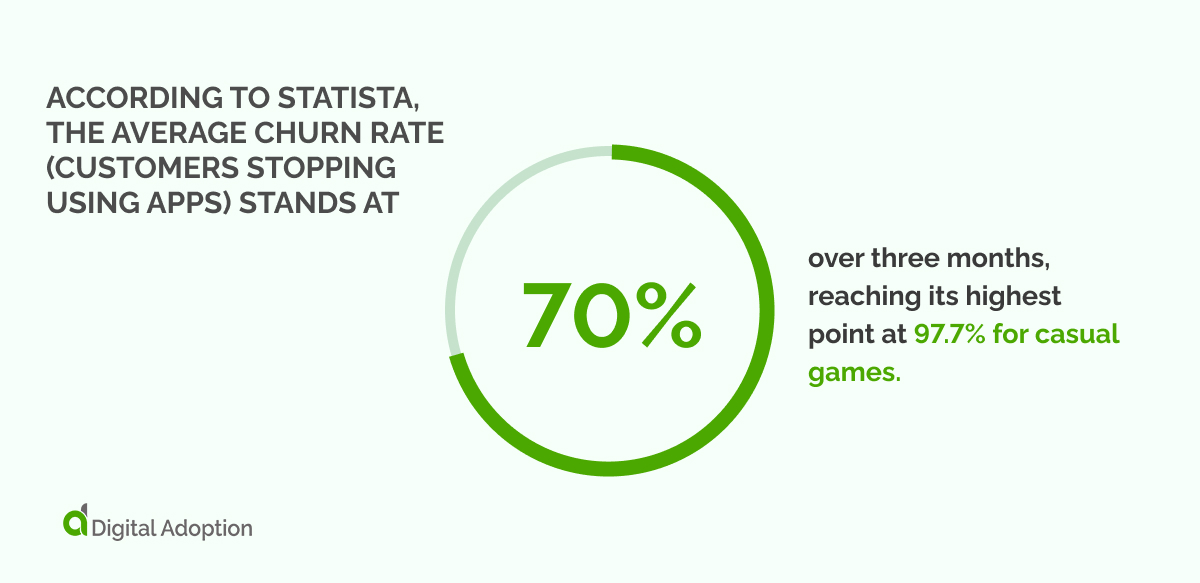
One of the most competitive markets is mobile technology applications. According to Statista, the average churn rate (customers stopping using apps) stands at 70% over three months, reaching its highest point at 97.7% for casual games.
Merely attracting users to try your product isn’t the ultimate goal; ensuring consistent usage requires a well-defined product adoption strategy and excellent customer engagement for the perfect sticky product.
Product-led growth hinges on cultivating product stickiness, ensuring users consistently return due to the engaging and enjoyable fulfillment of their needs.
While the average person installs eighty mobile apps—they typically use only nine daily. Therefore, you need to ensure that your products become part of every user’s daily nine for them to become sticky.
This article explores the concept of product stickiness and provides insights into crafting sticky products. It covers the definition of product stickiness, strategies for creating such products, methods for measuring product stickiness, and the utilization of data related to product stickiness.
What is product stickiness?

Product stickiness refers to the frequency with which users revisit your product due to its engaging and enjoyable nature in fulfilling their requirements.
Stickiness fuels growth by enhancing customer retention, offering account expansion opportunities, and elevating customer lifetime value.
The ratio of Daily Active Users to Monthly Active Users (DAUs/MAUs) stands out as one of the pivotal product stickiness metrics employed to gauge the stickiness of your product.
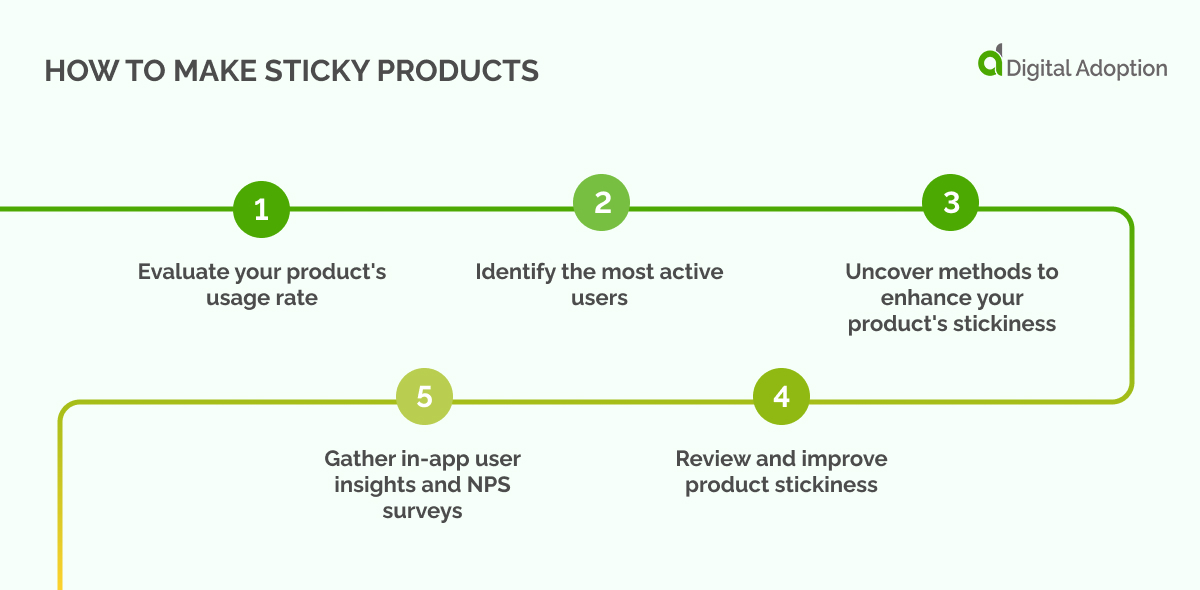
How to make sticky products
Once you have understood product stickiness, it is time to implement it.
The first step to making your products sticky is to evaluate your product’s usage rate through customer activity data analysis.
Step 1: Evaluate your product’s usage rate
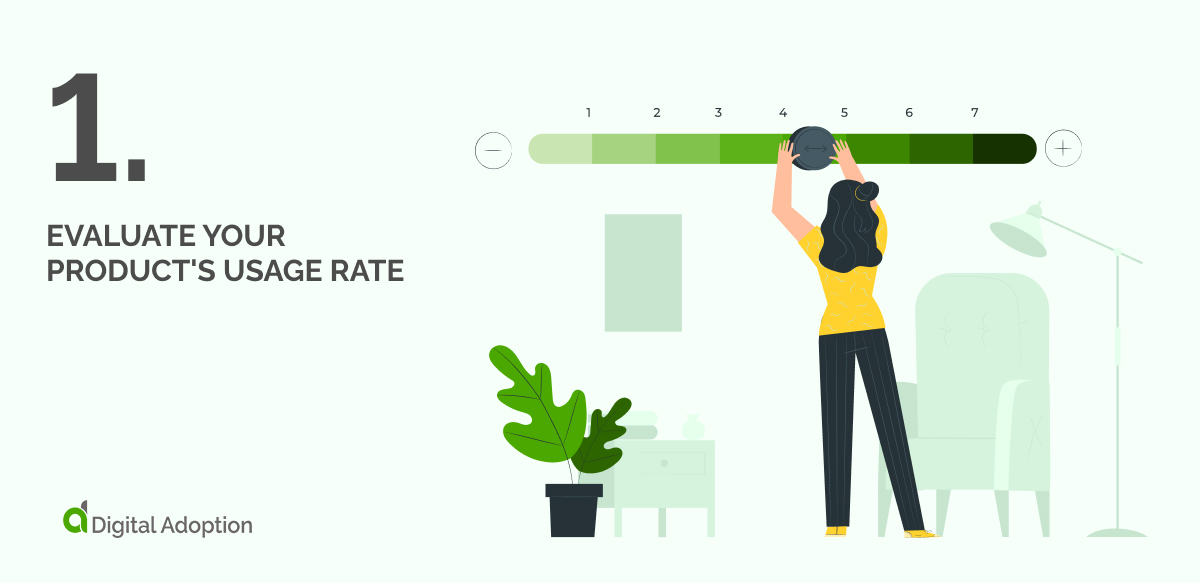
A product stickiness score isn’t a mystical shortcut to make users instantly adore your product overnight. At its essence, it’s simply a metric revealing user engagement by assessing daily and monthly active usage after collecting customer product activity data.
Before delving further, it’s crucial to comprehend your product usage and define daily and monthly active usage:
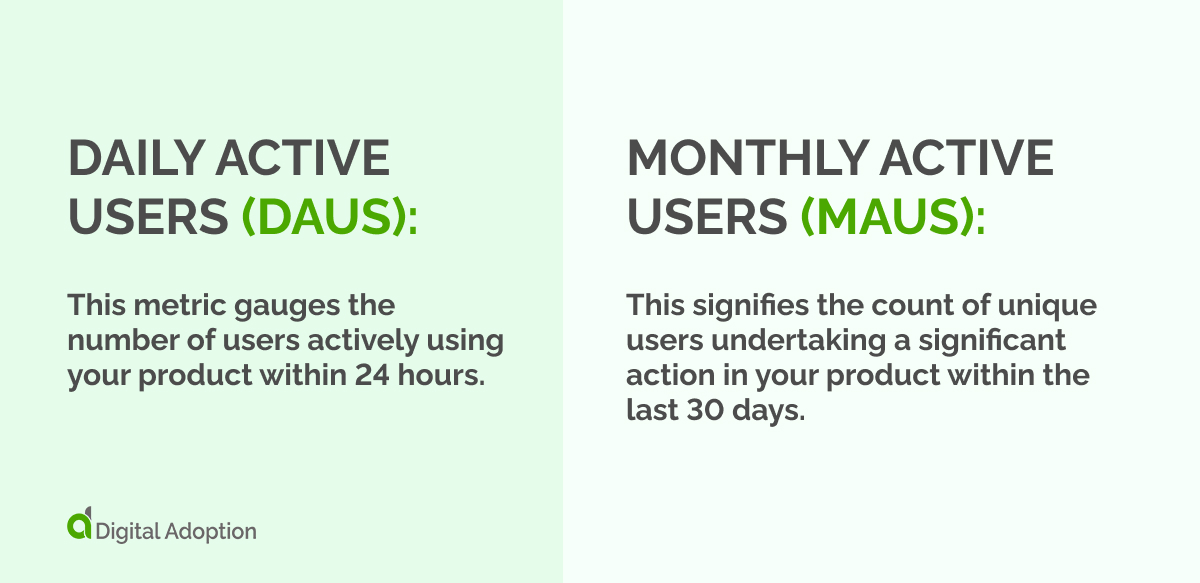
- Daily Active Users (DAUs): This metric gauges the number of users actively using your product within 24 hours.
- Monthly Active Users (MAUs): This signifies the count of unique users undertaking a significant action in your product within the last 30 days.
You might question, “Can’t I determine my product’s engaged users by measuring DAUs and MAUs?” The answer is both yes and no.
While active user metrics showcase users performing measurable actions daily, weekly, or monthly, without comparing these metrics against your product benchmarks, you can’t gauge your product engagement levels or leverage that data effectively.
Product stickiness reveals your daily active users as a fraction of your monthly active users, providing a more critical perspective on your user base.
It highlights your most active users, identifies potential churn, and empowers you to:
- Develop tailored promotional campaigns for users with lower stickiness scores prone to churn (for growth engineers).
- Segment users based on stickiness scores, directing re-engagement efforts towards those with low stickiness ratios (for marketers).
- Understand and target your most engaged users, reshaping marketing campaigns to appeal to similar audiences (for marketers).
- Calculate your product’s adoption rate, indicating how likely new users will continue using it.
Your product stickiness ratio transforms MAUs and DAUs from mere information into actionable product adoption metrics.
This metric empowers product managers and growth engineers to craft a well-rounded product strategy as you begin calculating product stickiness.
Step 2: Identify the most active users

Your product stickiness score unveils which active users exhibit the highest engagement levels, presenting a potent growth strategy as you analyze user behavior.
Rather than escalating your user acquisition budget and deploying various tactics to win over prospects, it’s more effective to target customers who are inherently inclined to use your product.
This process might feel perplexing at first, but bear with us. Product stickiness highlights your most engaged users. You can explore their use cases and demographics using product analytics, including age, location, acquisition channel, and pricing tier.
Analyzing these data points allows you to foresee the future, identifying customers more likely to respond positively to your marketing campaigns, promotional offers, and ads.
If Salesforce allocates a substantial part of its budget to target early-stage startups, the return on investment would be minimal, with a high likelihood of these new users eventually churning.
In contrast, based on its experience and stickiness rate analysis, Salesforce understands that its ideal customer is a large enterprise with tens or hundreds of Sales Development Representatives (SDRs).
These users find Salesforce helpful and are more likely to remain committed to the product in the long run. Product stickiness empowers you to discern your ideal users, enabling a focused allocation of marketing and growth resources tailored to them.
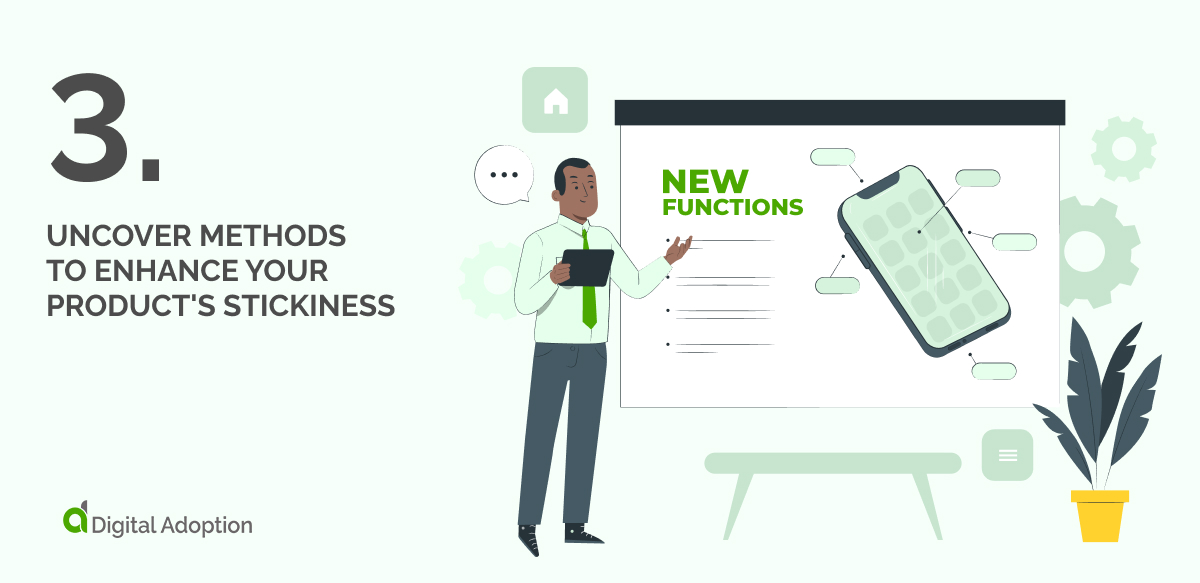
Step 3: Uncover methods to enhance your product’s stickiness
Product stickiness is a constructive feedback loop for your product—assessing it unveils recurring patterns within your user base. Closely examining these patterns provides insights into building a superior product or attracting ideal users.
Consider this scenario: If your product stickiness analysis indicates that the most engaged users belong to teams of 11 to 50 individuals, allocating less of your budget to promote your product to solopreneurs and single users might be prudent.
Product stickiness harnesses the power of product analytics, user behavior, and demographic patterns among your ideal users to guide enhancements to your brand, tailor your product, and shape the overall experience.
The aim is to cater to users who are more likely to develop a genuine affinity for your product.
Step 4: Review and improve product stickiness

It’s crucial to note that product stickiness alone isn’t a standalone growth strategy. It serves as a qualitative metric, indicating the proportion of highly engaged users.
The real impact on your product’s growth trajectory stems from how you leverage that data.
To amplify product stickiness, you must test diverse variations of your experiences of customer onboarding with DAP and in-app product messaging.
Start posing questions like:
- Which onboarding flow yields a higher number of engaged users?
- Does our in-app guidance contribute to enhanced user activation?
- Among re-engagement email campaigns, alerts, and notifications, which effectively reactivates inactive users?
- Which user segment is more prone to churn or evolve into power users?
- Where do friction points emerge in our user flows?
The essence of testing lies in uncovering commonalities among your most active users, crafting campaigns targeting those specific data points, and refining strategies to acquire and retain users efficiently.
DAP design fosters a culture of testing, enabling the creation of multiple versions of product tours, help docs, pop-ups, or automatic localization of content to onboard users in their preferred language.
Step 5: Gather in-app user insights and NPS surveys

While behavior analytics unveils patterns in user interactions with your product, its scope has limits.
Product and behavior analytics showcase how users engage with existing features, offering insights for optimization. However, they fail to reveal which features users desire from scratch or wish to eliminate.
Ensure a seamless process by proactively seeking direct inquiries instead of leaving it to chance, recognizing the indispensability of user feedback.
A DAP facilitates the distribution of open-ended feedback surveys, NPS surveys, and other feedback collection methods.
These surveys gauge users’ likelihood to recommend your product, accompanied by follow-up responses allowing them to express their reasons for loving or not loving your product.
Seamlessly embed these surveys in pop-ups, with extensive testing options to discern audience preferences and amass valuable product feedback.
In essence, a DAP aids product managers in comprehending user interactions with their products. Yet, this is only half of what the platform offers.
With a DAP, you can conduct A/B tests on multiple campaigns, design patterns, or UI elements, discerning preferences.
Doing so empowers your product team to construct a data-driven growth strategy, crafting a sticky and endearing product that users consistently return to.
How do you measure product stickiness?
User count plays a pivotal role in establishing a product’s stickiness ratio, necessitating additional studies even if they seem straightforward to compute.
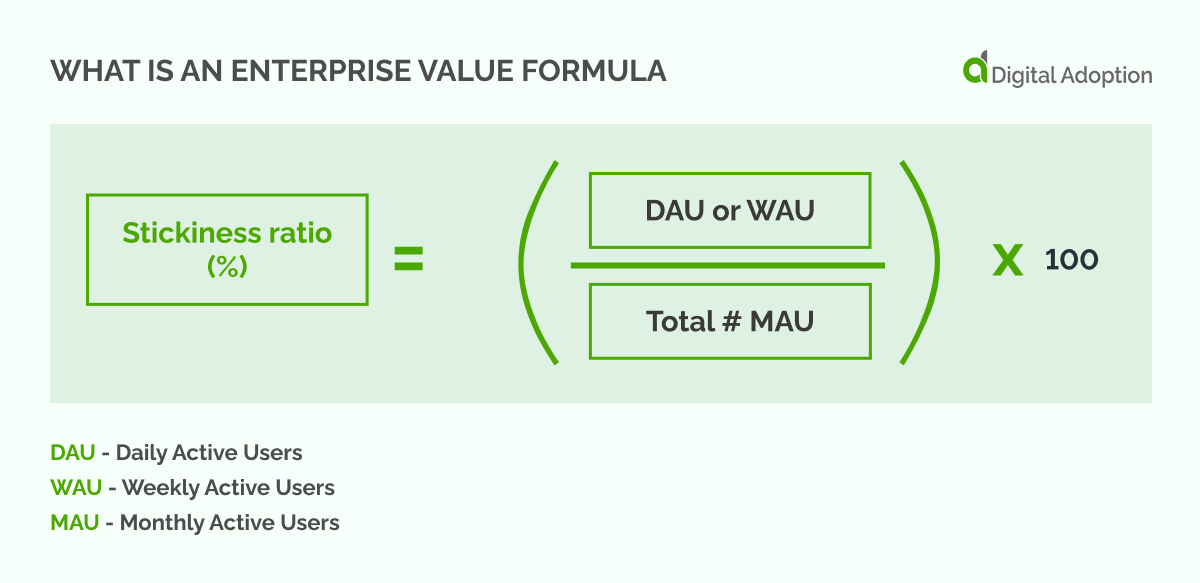
To calculate the product stickiness ratio, divide daily active users by monthly active users. This measurement is indispensable for assessing the stickiness ratio’s significance.
The product stickiness rate is a crucial product metric, offering insight into the product or service’s value. It depicts the frequency with which customers return to your product or service.
The product stickiness ratio formula empowers the product manager to gauge the necessary improvements over time. It also aids in understanding the substantial differences among user types and their usage patterns.
Even changes in user behavior over a predetermined period can be monitored.
Initially, the total number of users logged in during the last 30 days must be divided by the average daily or weekly login rate to compute the average daily or weekly login rate.
Daily recalculations provide the product stickiness ratio, representing a moving average of the customer retention rate over time.
Determining user retention and attrition solely based on this rate necessitates conducting cohort analysis to segment consumers according to their use cases.
Moreover, if customers use your app sparingly, the stickiness rate may not accurately reflect their engagement. Therefore, additional metrics such as customer lifetime value, churn rate, and retention rate become crucial for a comprehensive product evaluation.
How do you utilize product stickiness data?
The DAU/MAU ratio is a valuable metric for assessing another critical aspect of a product—its health. While the quantity of users, gauged by DAU or MAU, provides information, it fails to convey the quality of your user base.
For product leaders, the stickiness ratio proves instrumental, offering insights into the frequency of user interactions, variations in usage among different user types (personas), and their evolution over time.
A DAU/MAU ratio of 0.6 indicates that 60% of monthly visitors also engage with the product daily, signifying good product health.
It’s essential to note that a low DAU/MAU ratio doesn’t necessarily imply unhealthy product conditions, especially in cases involving multiple products.
The ratio may be low due to a combination of infrequent and dedicated users. In such instances, the focus should shift towards strategies to enhance the engagement of deeply involved users.
Remember that experience beats numbers
In the realm of product stickiness, it is imperative to consistently prioritize user experience over relying solely on metrics within your customer success teams.
While metrics such as DAU/MAU ratios undoubtedly offer valuable insights, the true essence of sustaining user engagement lies in meticulously crafting an immersive and valuable customer journey. Quantitative metrics alone may fall short of capturing the qualitative nuances that underpin user loyalty and retention.
Shift the focus towards creating an experience that resonates deeper, fostering genuine connections between users and your product. The aim is to develop an understanding that encourages long-term user returns and prompts users to advocate for your product within their networks due to the inherent quality of their interactions.
Upon achieving this holistic approach to user experience, the desired usage metrics will naturally and promptly follow suit, reflecting the success of your strategy in cultivating lasting user engagement.


